READING 1:
Class Limits, Boundaries And Intervals
Class Limits
Class limits are the smallest and largest observations (data, events etc) in each class. Therefore, each class has two limits: a lower and upper.
Example:
| Class | Frequency |
| 200 – 299 | 12 |
| 300 – 399 | 19 |
| 400 – 499 | 6 |
| 500 – 599 | 2 |
| 600 – 699 | 11 |
| 700 – 799 | 7 |
| 800 – 899 | 3 |
| Total Frequency | 60 |
Using the frequency table above, what are the lower and upper class limits for the first three classes?
For the first class, 200 – 299
The lower class limit is 200
The upper class limit is 299
For the second class, 300 – 399
The lower class limit is 300
The upper class limit is 399
For the third class, 400 – 499
The lower class limit is 400
The upper class limit is 499
Class Boundaries
Class Boundaries are the midpoints between the upper class limit of a class and the lower class limit of the next class in the sequence. Therefore, each class has an upper and lower class boundary.
Example:
| Class | Frequency |
| 200 – 299 | 12 |
| 300 – 399 | 19 |
| 400 – 499 | 6 |
| 500 – 599 | 2 |
| 600 – 699 | 11 |
| 700 – 799 | 7 |
| 800 – 899 | 3 |
| Total Frequency | 60 |
Using the frequency table above, determine the class boundaries of the first three classes.
For the first class, 200 – 299
The lower class boundary is the midpoint between 199 and 200, that is 199.5
The upper class boundary is the midpoint between 299 and 300, that is 299.5
For the second class, 300 – 399
The lower class boundary is the midpoint between 299 and 300, that is 299.5
The upper class boundary is the midpoint between 399 and 400, that is 399.5
For the third class, 400 – 499
The lower class boundary is the midpoint between 399 and 400, that is 399.5
The upper class boundary is the midpoint between 499 and 500, that is 499.5
Class Intervals
Class interval is the difference between the upper and lower class boundaries of any class.
Example:
| Class | Frequency |
| 200 – 299 | 12 |
| 300 – 399 | 19 |
| 400 – 499 | 6 |
| 500 – 599 | 2 |
| 600 – 699 | 11 |
| 700 – 799 | 7 |
| 800 – 899 | 3 |
| Total Frequency | 60 |
Using the table above, determine the class intervals for the first class.
For the first class, 200 – 299
The class interval = Upper class boundary – lower class boundary
Upper class boundary = 299.5
Lower class boundary = 199.5
Therefore, the class interval = 299.5 – 199.5 = 100
===========================================================
Class Interval
Comment on the following:
.1 What are the key differences between class limits, class boundaries and class intervals ?
.2 How will these differences impact the accuracy of the analysis?
===========================================================
READING 2:
class interval
Class Interval
Definition of Class Interval
While arranging large amount of data (in statistics), they are grouped into different classes to get an idea of the distribution, and the range of such class of data is called the Class Interval.
More about Class Interval
- Class intervals are generally equal in width and are mutually exclusive.
- The ends of a class interval are called class limits, and the middle of an interval is called a class mark.
- Class interval is generally used to draw histogram.
Example of Class Interval
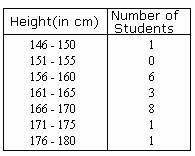
- In the table above, heights of 20 students of a class are divided into classes with the size of each class interval being 5.
Solved Example on Class Interval
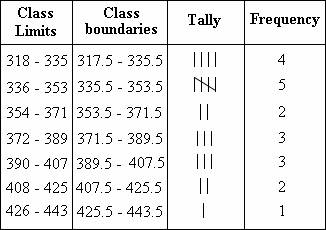
Plant scientists developed different varieties of corns that have a rich content of lysine which is a nutritious animal feed. A group of chicks were given this food to test the quality. Weight gains (in grams) of these chicks after 21 days are as recorded: 380, 321, 366, 356, 349, 337, 399, 384, 410, 329, 350, 340, 324, 396, 412, 420, 382, 318, 344, 438. By constructing a frequency distribution table for 7 classes, find the class interval in which the weight increase is maximum.
Choices:
A. 426 - 443
B. 335 - 351
C. 318 - 438
D. 336 - 353
Correct Answer: D
Solution:
Step 1: Range of the data = higher value - lower value = 438 - 318 = 120
Step 2: Width = Range/number of classes = 120/7 = 17.14 ˜ 18
[Round to the higher value.]
Step 3: Construct the class limits (weight gains) with width 18, so that the least and the highest values are included.
Step 4: The class limits, boundaries, tally marks and the frequency for each class (number of tally marks) are shown in the table.
Step 5:Step 6: The class interval in which the weight increase maximum is 336 - 353. [Frequency is more for the class 336 - 353.]
Comment on the following:
.1 What are the key differences between class limits, class boundaries and class intervals ?
.2 How will these differences impact the accuracy of the analysis?
No comments:
Post a Comment