Sunday, February 16, 2014
Tuesday, February 11, 2014
Lesson Summary for 11th February (Tuesday)
Today we started of with a G+ discussion (LINK HERE) of the differences between a
1. CIRCLE
2. ELLIPSE
3. PARABOLA
4. HYPERBOLA
Where Xintong's explanation was accurate and recommended by Mr Johari.
Conic Sections
![]() |
| A parabola has a line of symmetry, while a Hyperbola has 2 lines of symmetry, the transverse and longitudinal (Vertical and Horizontal) |
Equations of Circles
Discriminant
D<0
Imaginery Roots
D>0
Real and Distinct Roots
D=0
Real and Equal Roots
Methods to finding the centre of the circle and the Radius
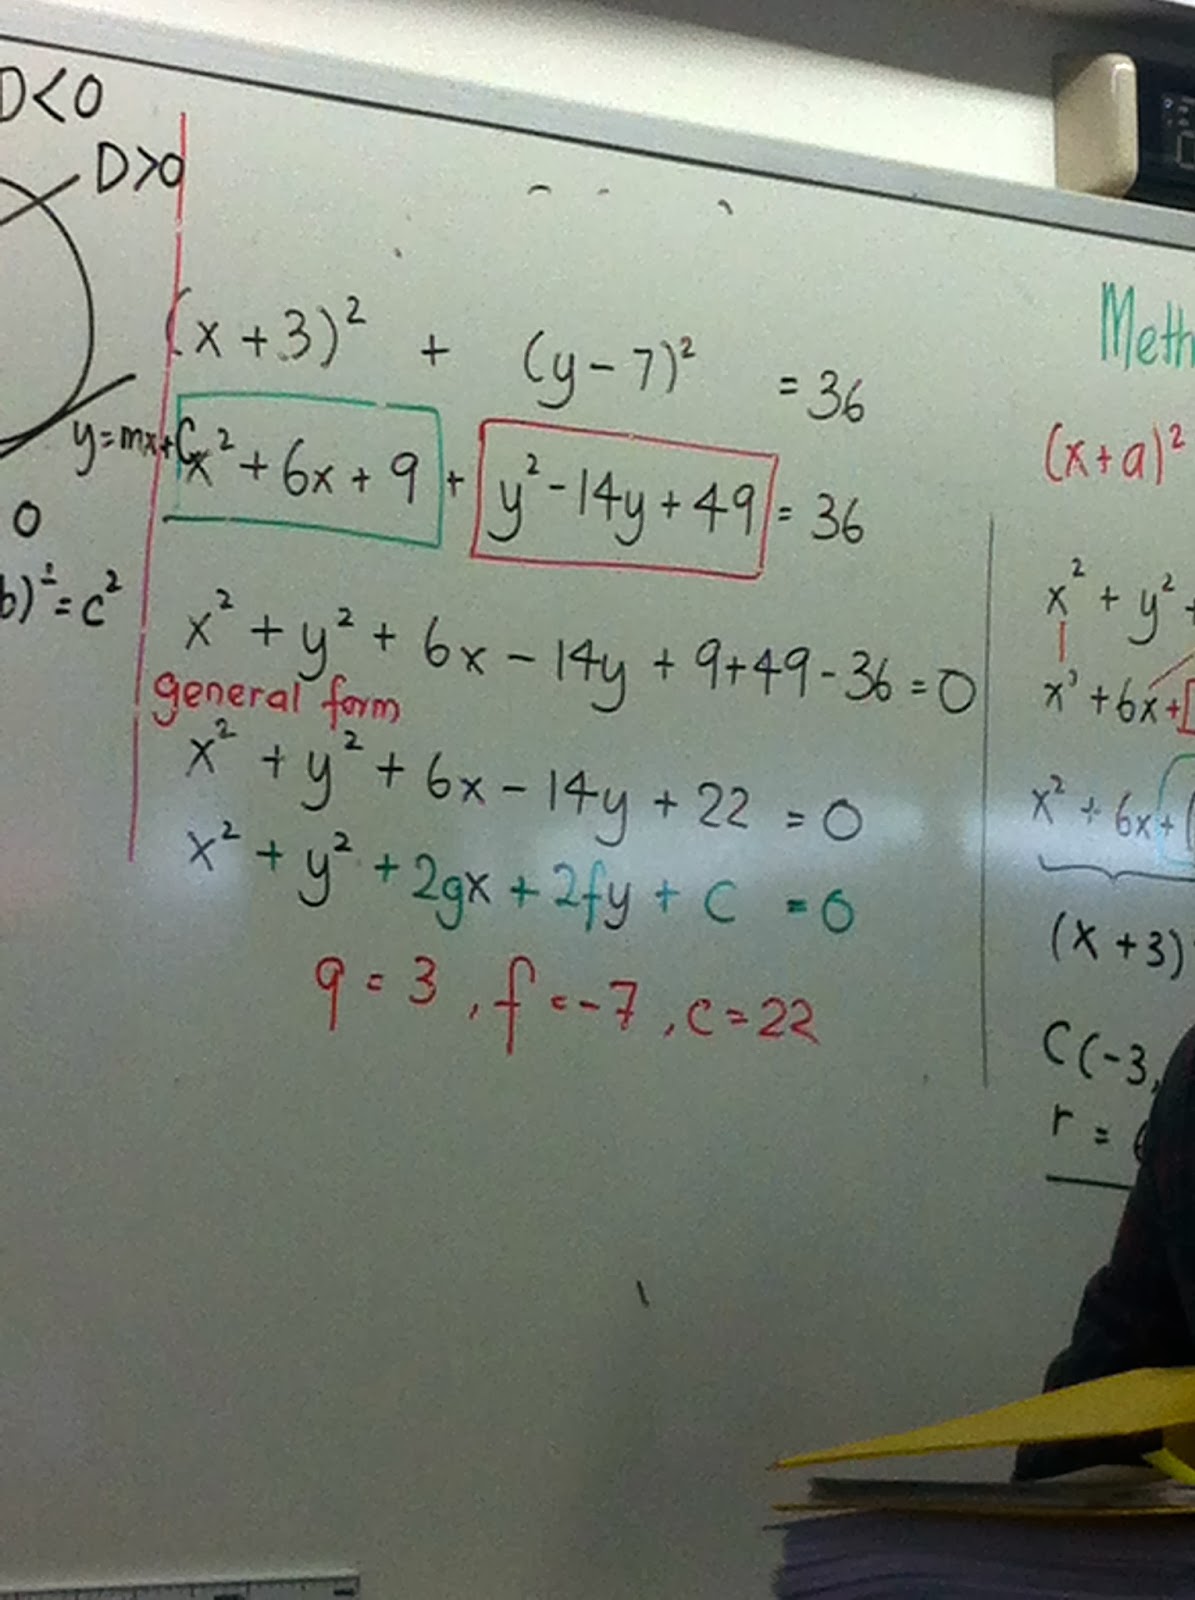
Method 1 (Completing the Square)
Method 2 (Comparing Coefficients)
General Form of the equation of a circle
Assignment Questions in (Further Coordinate Geometry: Equations of Circles)
Question 5 (Tier B)
Apparently it can intersect with each other
Question 8 (Tier C)
Closing Note
Homework: Use GeoGebra or any graphing application to test out assumptions
Quote:
"Your level test is going to hit you like a Meteor" - Mr Johari 2014
Done By Ryan Tan S4-09
Sunday, February 9, 2014
Lesson summary for Wednesday, 5th February
We did a quiz and went revised what standard deviation is.
—
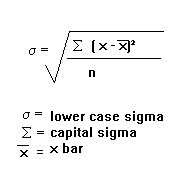
Standard deviation (σ is the symbol, is a measure of the variance from the mean for a set of data. It is calculated as follows:
x̄ (pronounced as x bar) is the mean of the data set.
n is the number of data in the set.
Σ, or summation, is the addition of all the following datum. In this case, it is (x-x̄)^2.
—
Showing the proper working during the examples is essential to getting the method mark(s).
For example,
Calculate the mean, median and standard deviation for the following set of data.
1,2,3
mean = (1+2+3)/3
= 3
Tmedian = (3+1)/2
= 2
median = 2
_________________________________
standard deviation = √( ( (1-2)^2 + (2-2)^2 + (3-2)^2 ) / 2 )
= 1
—
The standard deviation’s and mean’s working can be in the form of a table containing all the data, and you can just use the values of Σ(x-x̄), n and Σx to calculate your answers.
If there are UNITS in the question, be sure to write them down in your answers as well.
Other reminders:
- Write scale when drawing graphs
- Show ALL the working when calculating the standard deviation, mean and median.
Check out these G+ posts to learn how to use STAT functions in your calculator
https://plus.google.com/101616184095512416932/posts/19rLzDFWtzz
https://plus.google.com/101616184095512416932/posts/bucASRsM3jJ
p.s. Sorry for the late post!
—
Standard deviation (σ is the symbol, is a measure of the variance from the mean for a set of data. It is calculated as follows:
x̄ (pronounced as x bar) is the mean of the data set.
n is the number of data in the set.
Σ, or summation, is the addition of all the following datum. In this case, it is (x-x̄)^2.
—
Showing the proper working during the examples is essential to getting the method mark(s).
For example,
Calculate the mean, median and standard deviation for the following set of data.
1,2,3
mean = (1+2+3)/3
= 3
Tmedian = (3+1)/2
= 2
median = 2
_________________________________
standard deviation = √( ( (1-2)^2 + (2-2)^2 + (3-2)^2 ) / 2 )
= 1
—
The standard deviation’s and mean’s working can be in the form of a table containing all the data, and you can just use the values of Σ(x-x̄), n and Σx to calculate your answers.
If there are UNITS in the question, be sure to write them down in your answers as well.
Other reminders:
- Write scale when drawing graphs
- Show ALL the working when calculating the standard deviation, mean and median.
Check out these G+ posts to learn how to use STAT functions in your calculator
https://plus.google.com/101616184095512416932/posts/19rLzDFWtzz
https://plus.google.com/101616184095512416932/posts/bucASRsM3jJ
p.s. Sorry for the late post!
Wednesday, January 29, 2014
Probability summary
(Sorry I just realized I posted this on the old 309 math blog)
Probability:
_________________________________________________________________________________
Probability: How likely an event can occur
Probability = The number of ways of achieving desired outcome
Total number of possible outcomes
Event will definitely occur = 1
Event will never occur = 0
Event will not occur = 1 - probability of event occurring
_________________________________________________________________________________
Sample space: All the possible outcomes of an experiment
S = {a, b, c ...}
Sample point = 1 of the possible outcomes
_________________________________________________________________________________
Mutually exclusive: Both events cannot occur at the same time
Probability (A or B) = P(A) + P(B)
Independent events: Both events can occur at the same time; Outcome does not affect probability of outcome of other event
Probability (A and B) = P(A) x P(B)
_________________________________________________________________________________
Diagrams:
Probability diagrams:
Used for two independent events
Tree diagram:
Used for two or more events
Tuesday, January 28, 2014
28th Jan Recap
Math File
Use an orange/red ring file .
1. Notes Earliest at the bottom .
2. Assignments
3. Quizzes
> Repeat for each topic
----------------------------------------------------------------------------------------------------------------------------------
Mean , Median and Mode
.They are important for their own purposes depending on the analysis you want to carry out .
. Mean is very subjective as there is an outlier that can severely affect the data .
. Median is the 50% mark , letting you see how the performance of a group is .
. Mode lets you see the most popular set of data and the trends .
Box Plot
Lower percentile - Underperforming
Upper percentile - Excelling > Able to plot data using the 2 points
. Box Plots let you see performances better for evaluation ( Better than Ogive)
- It is easier to see if the data is skewed ( Biased or shifted towards) based on where Q1 , Q2 and Q3 is
- Look at interquartile range and range to determine spread and performance as a whole .
To transfer the box plot into a cumulative frequency against value graph ,
a) Plot it vertically using Q1 , Q2 and Q3 as points
b) Plot it horizontally to see how everyone is performing .
Use an orange/red ring file .
1. Notes Earliest at the bottom .
2. Assignments
3. Quizzes
> Repeat for each topic
----------------------------------------------------------------------------------------------------------------------------------
Mean , Median and Mode
.They are important for their own purposes depending on the analysis you want to carry out .
. Mean is very subjective as there is an outlier that can severely affect the data .
. Median is the 50% mark , letting you see how the performance of a group is .
. Mode lets you see the most popular set of data and the trends .
Box Plot
Lower percentile - Underperforming
Upper percentile - Excelling > Able to plot data using the 2 points
. Box Plots let you see performances better for evaluation ( Better than Ogive)
- It is easier to see if the data is skewed ( Biased or shifted towards) based on where Q1 , Q2 and Q3 is
- Look at interquartile range and range to determine spread and performance as a whole .
To transfer the box plot into a cumulative frequency against value graph ,
a) Plot it vertically using Q1 , Q2 and Q3 as points
b) Plot it horizontally to see how everyone is performing .
Tuesday, January 21, 2014
MONITORING OF MARKS
HI ALL,
Please check that the tabulation of marks are correct to date.
Those with R please redo the worksheet as they have either incomplete statement or wrong mathematical notation used.
All the materials must be filed in the following order:
.1 Notes
.2 Assignments
.3 Quizzes (assessments)
according to topic:
.A Financial Matters (Practical Application) - 2 assignments
.B Probability - 4 assignments
.C Statistics - 1 assignment with 1 due in Week 5
.E Geometric Constructions - 1 assignment due in Week 6
.F Equation of Circle - 1 assignment in Week 7
.G Plane Geometry - 1 assignment in Week 7
Should you need assistance in understanding the concept do approach me or your friends.
Key:
Marks highlighted in blue indicate excellent to outstanding quality
cell in Pink indicates no submission or work not received (reasons not stated)
R indicates work has to be resubmitted due to quality or concept
A+ outstanding work submitted
LEVEL TEST
please note the following:
TOPICS covered for Level Test (EM & AM)
ensure that you are familiar with the topics to be tested. As secondary 4 is a critical year for assessment you are expected to review past topics covered in secondary 3 and lower secondary. The regular short class quizzes administered by your ST help to review the past and new knowledge and skills.
APPARATUS and EQUIPMENTS
Ensure that you have the approved scientific calculator (with the SST sticker)
- familiarise yourself with the functions such as the STATs function
Geometrical sets (compass, protractor, rules, eraser, decent pencil)
Please check that the tabulation of marks are correct to date.
Those with R please redo the worksheet as they have either incomplete statement or wrong mathematical notation used.
All the materials must be filed in the following order:
.1 Notes
.2 Assignments
.3 Quizzes (assessments)
according to topic:
.A Financial Matters (Practical Application) - 2 assignments
.B Probability - 4 assignments
.C Statistics - 1 assignment with 1 due in Week 5
.E Geometric Constructions - 1 assignment due in Week 6
.F Equation of Circle - 1 assignment in Week 7
.G Plane Geometry - 1 assignment in Week 7
Should you need assistance in understanding the concept do approach me or your friends.
Marks highlighted in blue indicate excellent to outstanding quality
cell in Pink indicates no submission or work not received (reasons not stated)
R indicates work has to be resubmitted due to quality or concept
A+ outstanding work submitted
LEVEL TEST
please note the following:
TOPICS covered for Level Test (EM & AM)
ensure that you are familiar with the topics to be tested. As secondary 4 is a critical year for assessment you are expected to review past topics covered in secondary 3 and lower secondary. The regular short class quizzes administered by your ST help to review the past and new knowledge and skills.
APPARATUS and EQUIPMENTS
Ensure that you have the approved scientific calculator (with the SST sticker)
- familiarise yourself with the functions such as the STATs function
Geometrical sets (compass, protractor, rules, eraser, decent pencil)
Subscribe to:
Posts (Atom)