Showing posts with label Lesson Summary. Show all posts

Tuesday, February 11, 2014

Lesson Summary for 11th February (Tuesday)


Today we started of with a G+ discussion (LINK HERE) of the differences between a

1. CIRCLE
2. ELLIPSE
3. PARABOLA

4. HYPERBOLA 

Where Xintong's explanation was accurate and recommended by Mr Johari.


Conic Sections

A parabola has a line of symmetry, while a Hyperbola has 2 lines of symmetry, the transverse and longitudinal (Vertical and Horizontal)


Equations of Circles


Discriminant


D<0 

Imaginery Roots

D>0

Real and Distinct Roots

D=0

Real and Equal Roots


Methods to finding the centre of the circle and the Radius

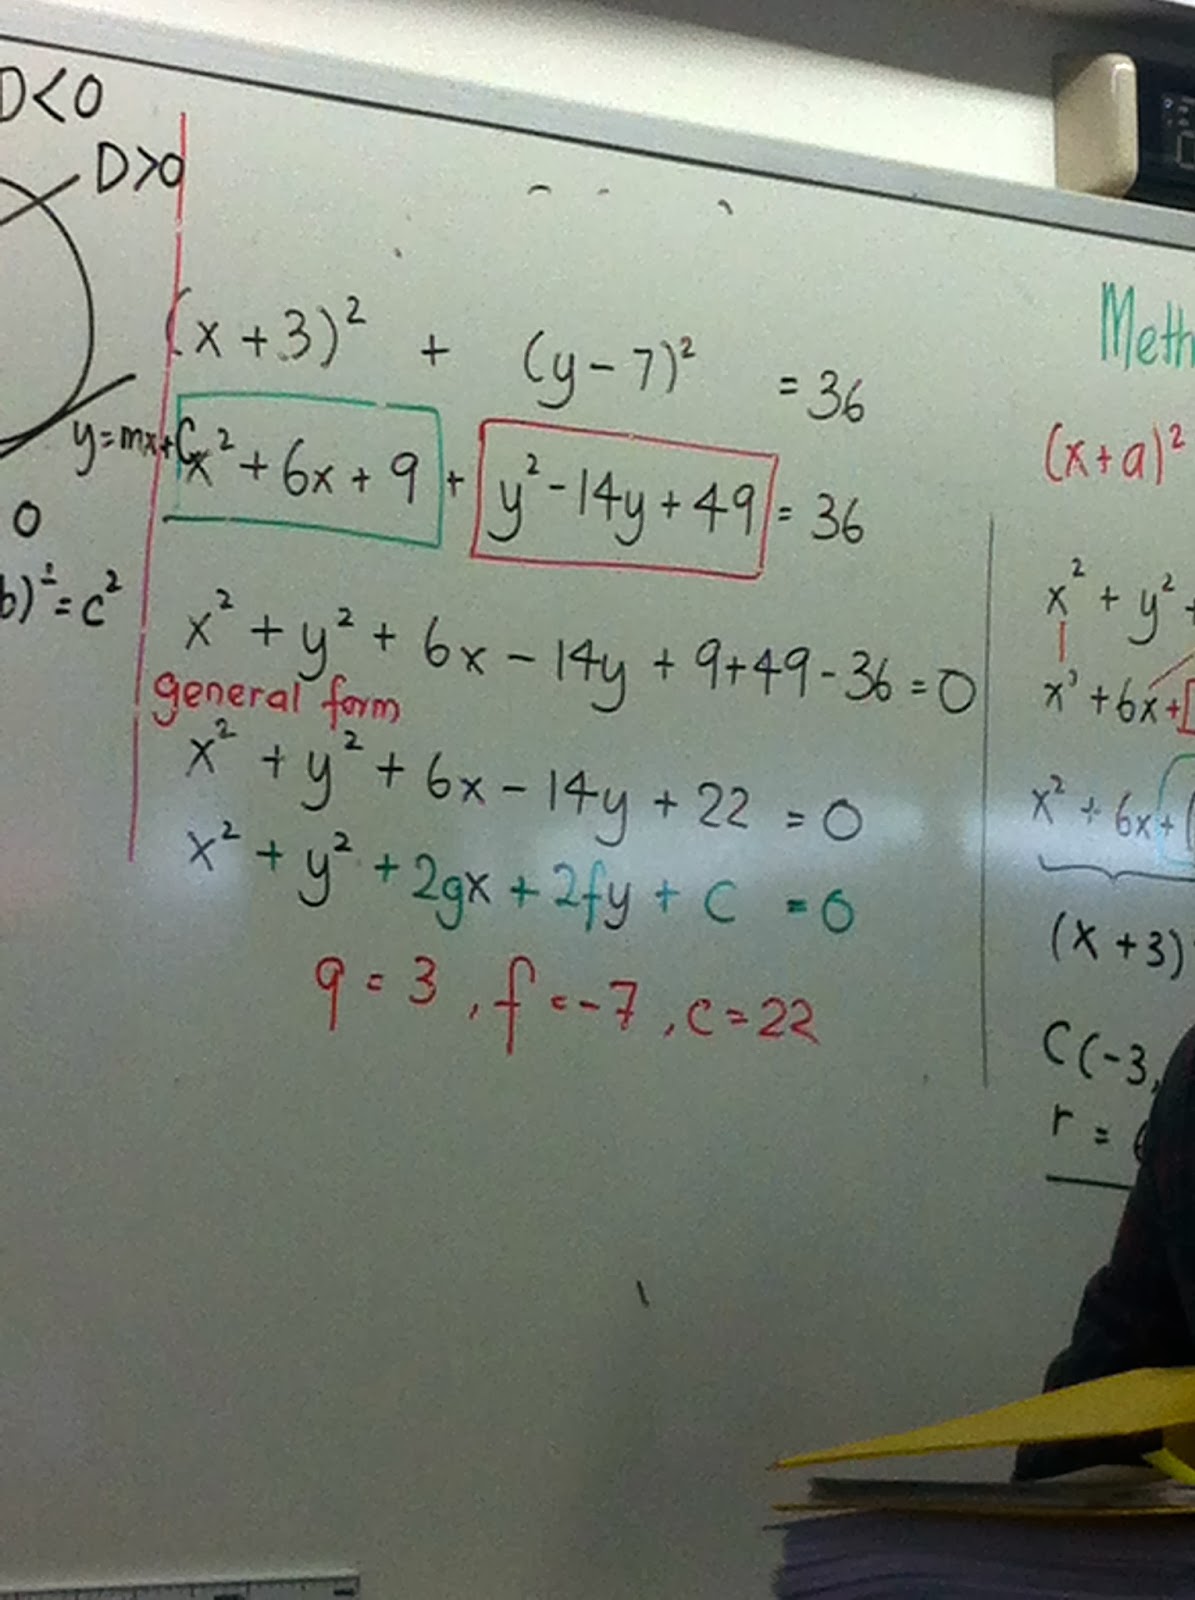
Method 1 (Completing the Square)


Method 2 (Comparing Coefficients)


General Form of the equation of a circle


Assignment Questions in (Further Coordinate Geometry: Equations of Circles)


Question 5 (Tier B)


Apparently it can intersect with each other 


Question 8 (Tier C)


Closing Note

Homework: Use GeoGebra or any graphing application to test out assumptions

Quote:
"Your level test is going to hit you like a Meteor" - Mr Johari 2014


Done By Ryan Tan S4-09

Sunday, February 9, 2014

Lesson summary for Wednesday, 5th February

We did a quiz and went revised what standard deviation is.


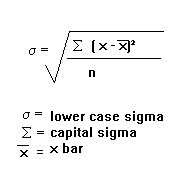
Standard deviation (σ is the symbol, is a measure of the variance from the mean for a set of data. It is calculated as follows:


x̄ (pronounced as x bar) is the mean of the data set.
n is the number of data in the set.
Σ, or summation, is the addition of all the following datum. In this case, it is (x-x̄)^2.


Showing the proper working during the examples is essential to getting the method mark(s).

For example,

Calculate the mean, median and standard deviation for the following set of data.

1,2,3

mean = (1+2+3)/3
     = 3

Tmedian = (3+1)/2
        = 2
median = 2
                                    _________________________________
standard deviation = √(  (  (1-2)^2  +  (2-2)^2  +  (3-2)^2  ) / 2  )
                   = 1


The standard deviation’s and mean’s working can be in the form of a table containing all the data, and you can just use the values of Σ(x-x̄), n and Σx to calculate your answers.

If there are UNITS in the question, be sure to write them down in your answers as well.

Other reminders:

- Write scale when drawing graphs
- Show ALL the working when calculating the standard deviation, mean and median.

Check out these G+ posts to learn how to use STAT functions in your calculator
https://plus.google.com/101616184095512416932/posts/19rLzDFWtzz
https://plus.google.com/101616184095512416932/posts/bucASRsM3jJ

p.s. Sorry for the late post!

Wednesday, January 29, 2014

29th Jan Recap


Homework = Statistics (b) Due next friday

Probability summary


(Sorry I just realized I posted this on the old 309 math blog)

Probability: 
_________________________________________________________________________________

Probability: How likely an event can occur

Probability =   The number of ways of achieving desired outcome
                                    Total number of possible outcomes

Event will definitely occur = 1

Event will never occur = 0

Event will not occur = 1 - probability of event occurring
_________________________________________________________________________________

Sample space: All the possible outcomes of an experiment

S = {a, b, c ...}

Sample point = 1 of the possible outcomes
_________________________________________________________________________________

Mutually exclusive: Both events cannot occur at the same time

Probability (A or B) = P(A) + P(B)

Independent events: Both events can occur at the same time; Outcome does not affect probability of outcome of other event

Probability (A and B) = P(A) x P(B)
_________________________________________________________________________________

Diagrams:

Probability diagrams:


Used for two independent events

Tree diagram: 

Used for two or more events


Tuesday, January 28, 2014

28th Jan Recap

Math File
Use an orange/red ring file .
1.  Notes                                Earliest at the bottom .
2. Assignments
3. Quizzes    
> Repeat for each topic
----------------------------------------------------------------------------------------------------------------------------------
Mean , Median and Mode
.They are important for their own purposes depending on the analysis you want to carry out .
. Mean is very subjective as there is an outlier that can severely affect the data .
. Median is the 50% mark , letting you see how the performance of a group is .
. Mode lets you see the most popular set of data and the trends .

Box Plot 


Lower percentile - Underperforming
Upper percentile - Excelling                                > Able to plot data using the 2 points

. Box Plots let you see performances better for evaluation ( Better than Ogive)
- It is easier to see if the data is skewed ( Biased or shifted towards) based on where Q1 , Q2 and Q3 is
- Look at interquartile range and range to determine spread and performance as a whole .

To transfer the box plot into a cumulative frequency against value graph ,
a) Plot it vertically using Q1 , Q2 and Q3 as points
b) Plot it horizontally to see how everyone is performing .

Wednesday, January 15, 2014

Lesson Summary (15/1/14)

Things to note :
Conditions for drawing histogram
1. Fit graph paper
2. Only use the zig-zag lines if the intercepts are insignificant
3. The zig-zag lines are only used for x-axis not y-axis.
    if used for y-axis, drawing of the bars or curve will be affected.
4. No repeating of the zig-zag lines in an axis.

PS I apologise if this is a disappointing post.

Tuesday, January 14, 2014

Lesson summary 14/1/14 (Crystal)

When there are a lot of datas to analyse like the examples given, it's easier to classify the datas into groups for analysis.
The class limits are composed of the lower class limit and the upper class limit. Each class has a respective set of class limits. 


When making a histogram, there should be no gaps between the bars. Therefore, the midpoints between the upper class limit of a class and the lower class limit of the next class in the sequence are calculated to be the class boundaries.

Class interval is the difference between two adjacent class boundaries.


Saturday, January 11, 2014

Lesson Summary : Example17b (Jemima)

Problem:
Example 17b:
Mr Fong was 64 years old in 2012. He earned $250,000 in 2012. His chargeable income for the Year of Assessment (YA) 2013 is computed as follows:

$
$
Total Employment Income

250,000
Less: Donations

       250
Assessable Income*

249,750
Less: Reliefs


Earned Income Relief
8,000

Employee CPF contribution relief
6,375
14,375
Chargeable Income*

235,375
What is Mr Fong's tax payable on his chargeable income of $235,375?


Solution:
First $200,000                     20,750.00
Next $35375 at 18%              6367.50
                                      _____________
Gross tax payable                 27117.50

Less: YA 2013                        1500.00
Personal tax rebate
(Max of $1500)
                                       _____________
                                             25,617.50

Mr Fong's tax payable is $25,617.50.

Tuesday, January 7, 2014

7/1/14 lesson summary

What is interest?
Money paid regularly at a particular rate for the use of money lent, or for delaying the repayment of a debt.

Terms to familiar yourself with:

Principle [P] - The initial sum of money to calculate the interest on, also commonly known as the amount borrowed.

Interest Rate [r] - The percentage of the principle that will be paid as an interest in a certain time period.

Time [t] - Regular-spaced time intervals to collect interest.

Simple Interest Formula: Interest [I] = P x r x t

Compound Interest includes interest on interest already paid or changed.

Compound Interest Formula: I = P(1+(r/100)^t - P

how the formula is derived: