Sunday, February 16, 2014
Tuesday, February 11, 2014
Lesson Summary for 11th February (Tuesday)
Today we started of with a G+ discussion (LINK HERE) of the differences between a
1. CIRCLE
2. ELLIPSE
3. PARABOLA
4. HYPERBOLA
Where Xintong's explanation was accurate and recommended by Mr Johari.
Conic Sections
 |
| A parabola has a line of symmetry, while a Hyperbola has 2 lines of symmetry, the transverse and longitudinal (Vertical and Horizontal) |
Equations of Circles
Discriminant
D<0
Imaginery Roots
D>0
Real and Distinct Roots
D=0
Real and Equal Roots
Methods to finding the centre of the circle and the Radius
Method 1 (Completing the Square)
Method 2 (Comparing Coefficients)
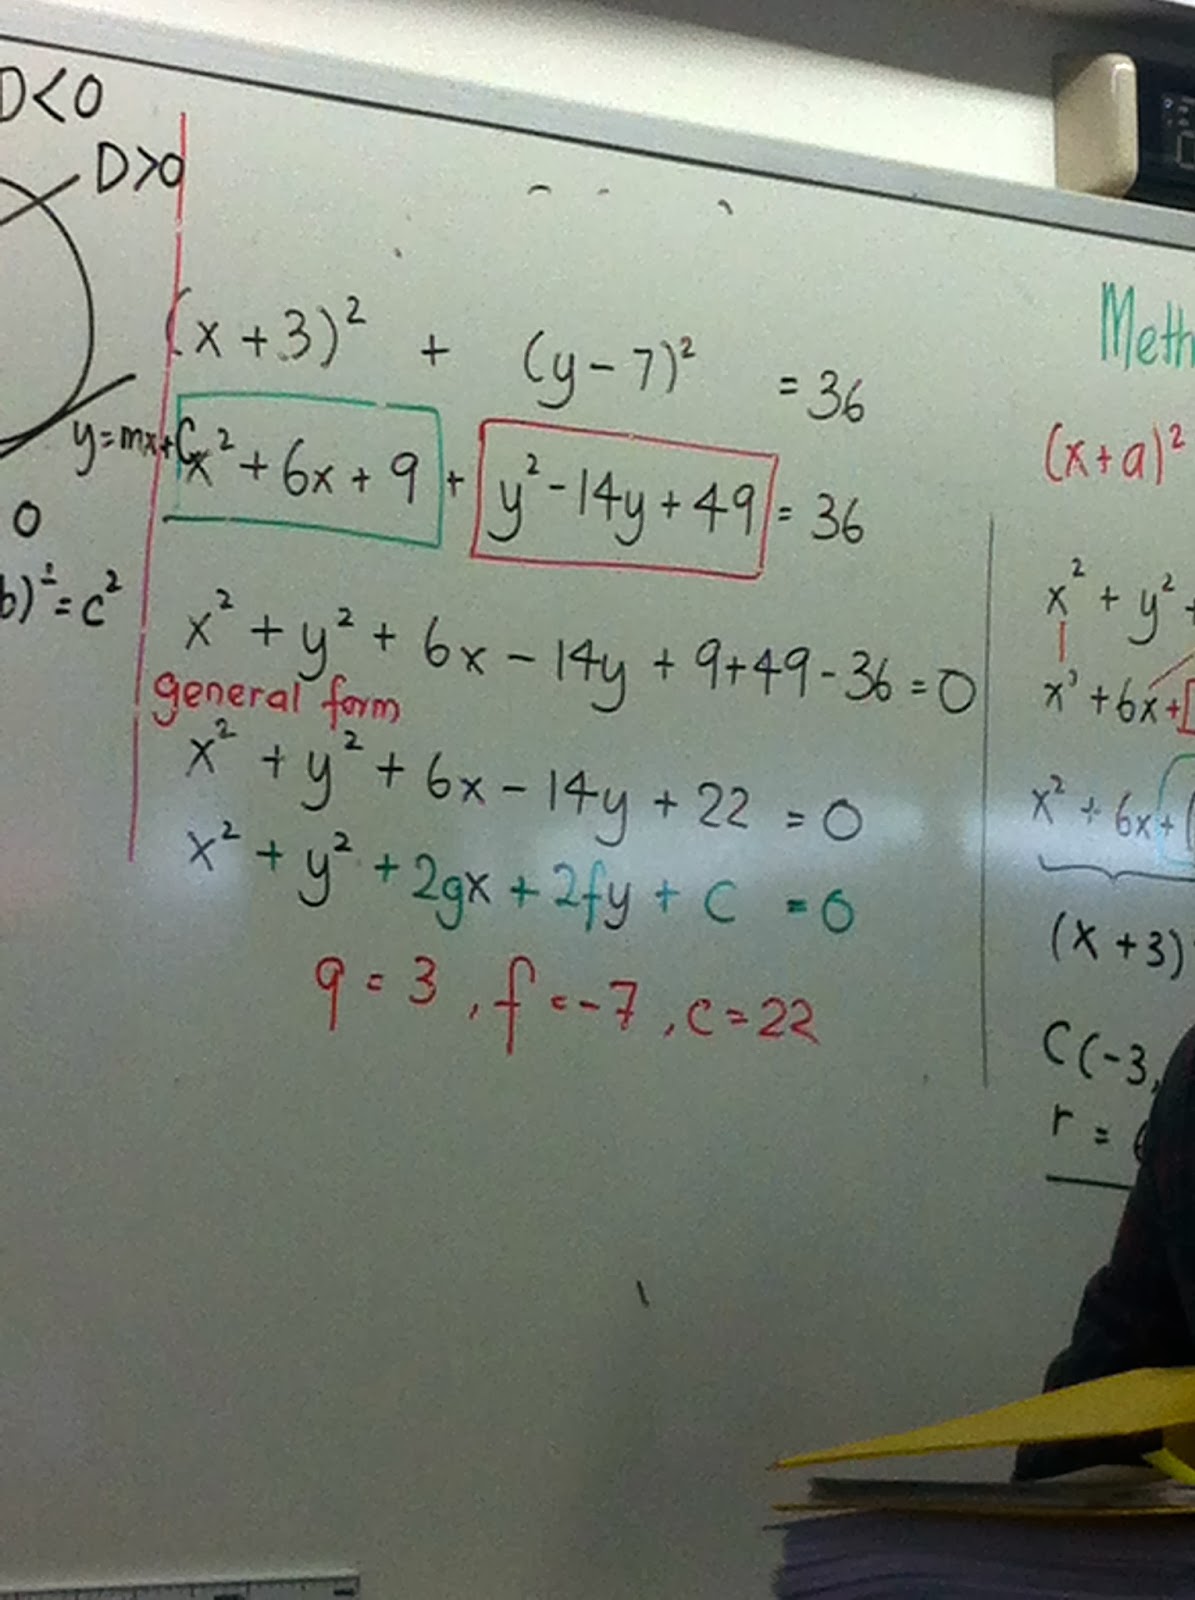
General Form of the equation of a circle
Assignment Questions in (Further Coordinate Geometry: Equations of Circles)
Question 5 (Tier B)
Apparently it can intersect with each other
Question 8 (Tier C)
Closing Note
Homework: Use GeoGebra or any graphing application to test out assumptions
Quote:
"Your level test is going to hit you like a Meteor" - Mr Johari 2014
Done By Ryan Tan S4-09
Sunday, February 9, 2014
Lesson summary for Wednesday, 5th February
We did a quiz and went revised what standard deviation is.
—
Standard deviation (σ is the symbol, is a measure of the variance from the mean for a set of data. It is calculated as follows:
x̄ (pronounced as x bar) is the mean of the data set.
n is the number of data in the set.
Σ, or summation, is the addition of all the following datum. In this case, it is (x-x̄)^2.
—
Showing the proper working during the examples is essential to getting the method mark(s).
For example,
Calculate the mean, median and standard deviation for the following set of data.
1,2,3
mean = (1+2+3)/3
= 3
Tmedian = (3+1)/2
= 2
median = 2
_________________________________
standard deviation = √( ( (1-2)^2 + (2-2)^2 + (3-2)^2 ) / 2 )
= 1
—
The standard deviation’s and mean’s working can be in the form of a table containing all the data, and you can just use the values of Σ(x-x̄), n and Σx to calculate your answers.
If there are UNITS in the question, be sure to write them down in your answers as well.
Other reminders:
- Write scale when drawing graphs
- Show ALL the working when calculating the standard deviation, mean and median.
Check out these G+ posts to learn how to use STAT functions in your calculator
https://plus.google.com/101616184095512416932/posts/19rLzDFWtzz
https://plus.google.com/101616184095512416932/posts/bucASRsM3jJ
p.s. Sorry for the late post!
—
Standard deviation (σ is the symbol, is a measure of the variance from the mean for a set of data. It is calculated as follows:
x̄ (pronounced as x bar) is the mean of the data set.
n is the number of data in the set.
Σ, or summation, is the addition of all the following datum. In this case, it is (x-x̄)^2.
—
Showing the proper working during the examples is essential to getting the method mark(s).
For example,
Calculate the mean, median and standard deviation for the following set of data.
1,2,3
mean = (1+2+3)/3
= 3
Tmedian = (3+1)/2
= 2
median = 2
_________________________________
standard deviation = √( ( (1-2)^2 + (2-2)^2 + (3-2)^2 ) / 2 )
= 1
—
The standard deviation’s and mean’s working can be in the form of a table containing all the data, and you can just use the values of Σ(x-x̄), n and Σx to calculate your answers.
If there are UNITS in the question, be sure to write them down in your answers as well.
Other reminders:
- Write scale when drawing graphs
- Show ALL the working when calculating the standard deviation, mean and median.
Check out these G+ posts to learn how to use STAT functions in your calculator
https://plus.google.com/101616184095512416932/posts/19rLzDFWtzz
https://plus.google.com/101616184095512416932/posts/bucASRsM3jJ
p.s. Sorry for the late post!
Subscribe to:
Posts (Atom)


